Zero-Code Java Auto-Instrumentation with the Kubernetes OpenTelemetry Operator
This guide extends the Grafana OpenTelemetry Workshop and walks through deploying the OpenTelemetry Operator on Kubernetes and using it to automatically instrument a Java application — without modifying a single line of application code or adding any OTel dependencies.
How it works
The OpenTelemetry Operator runs as a Kubernetes controller and installs a mutating admission webhook into your cluster. A mutating admission webhook intercepts API server requests (in this case Pod creation) and can modify the object before it is persisted. The operator uses this to inject instrumentation transparently.
When you annotate a Pod template, here is exactly what happens at creation time:
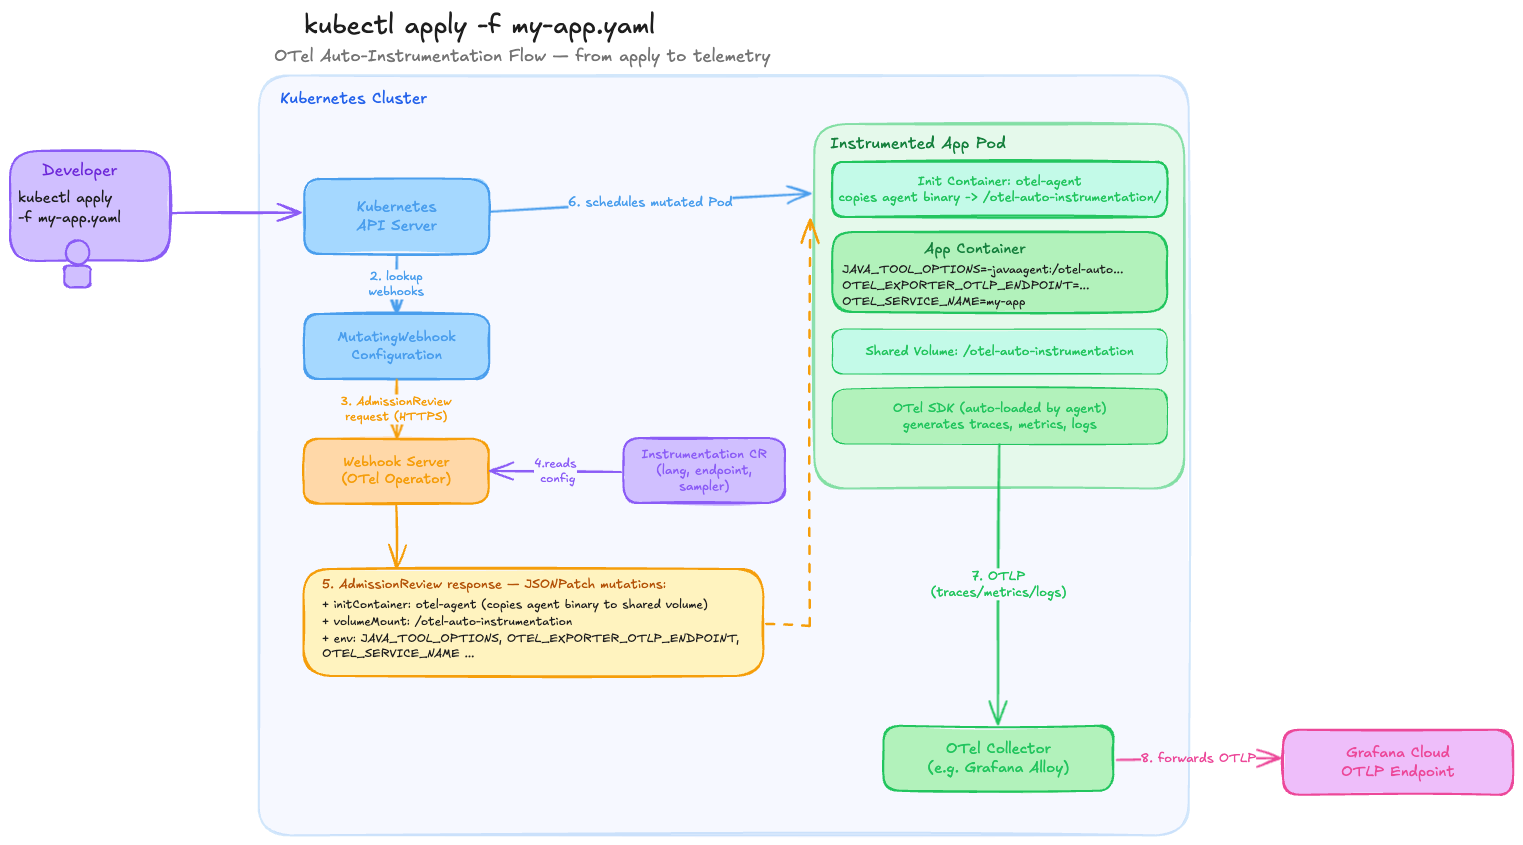
Here's the focused kubectl apply flow, numbered step by step:
- Developer runs
kubectl apply -f my-app.yaml— the Deployment and Service manifest is POSTed to the API Server - API Server looks up MutatingWebhookConfiguration — sees a rule matching Pod creates in the annotated namespace
- AdmissionReview request sent to the Webhook Server (OTel Operator) over HTTPS
- Webhook Server reads the Instrumentation CR (Custom Resource) — pulls the language, OTLP endpoint, sampler, and resource attribute config
- Webhook returns a JSONPatch — three mutations: an init container (copies the Opentelemetry agent binary), a shared volume mount, and the
OTEL_*env vars - API Server schedules the mutated Pod — Kubernetes sees the patched spec as if you'd written it yourself
- OTel SDK auto-loads in the app container — no code change needed; sends OTLP telemetry to the OpenTelemetry Collector (e.g. Grafana Alloy)
- Collector forwards to Grafana Cloud OTLP endpoint which ultimately stores metrics in Grafana Cloud Metrics (Mimir), logs in Grafana Cloud Logs (Loki), traces in Grafana Cloud Traces (Tempo) and, if enabled, profiles in Grafana Cloud Profiles (Pyroscope).
The operator introduces two new custom resources (CRDs):
OpenTelemetryCollector— deploy and manage an OTel Collector instance inside your cluster. In this lab, we won't deploy the OpenTelemetry Collector but use Grafana Alloy instead, deployed separately from the Operator.Instrumentation— define the instrumentation configuration (exporter endpoint, propagators, sampler) that the webhook reads when injecting into pods.
In this workshop, we are basically following this official OpenTelemetry documentation about Injecting Auto-instrumentation.
Prerequisites
kubectlandhelminstalled- Docker (to build and push the app image)
Step 1 — Create a kind cluster
We use kind to deploy a local Kubernetes cluster running on your laptop. You can use any other Kubernetes cluster of your choice if you already have one.
Create a multi-node kind cluster as explained here.
Verify the cluster is up and running:
Step 2 - Deploy the k8s-monitoring helm chart (Alloy)
Deploy the K8s-monitoring helm chart as explained here.
The environment variables should look similar to this:
GRAFANA_METRICS_URL="https://prometheus-prod-24-prod-eu-west-2.grafana.net/api/prom/push"
GRAFANA_METRICS_USER="456789"
GRAFANA_CLUSTER_METRICS_URL="https://prometheus-prod-24-prod-eu-west-2.grafana.net/api/prom"
GRAFANA_LOGS_URL="https://logs-prod-012.grafana.net/loki/api/v1/push"
GRAFANA_LOGS_USER="234567"
GRAFANA_OTLP_URL="https://otlp-gateway-prod-eu-west-2.grafana.net/otlp"
GRAFANA_OTLP_USER="123456"
GRAFANA_PROFILES_URL="https://profiles-prod-002.grafana.net"
GRAFANA_PROFILES_USER="123456"
GRAFANA_ACCESS_TOKEN="glc_eyJv..."
Step 3 — Install cert-manager
The OTel Operator's admission webhook must be served over HTTPS. cert-manager provisions and rotates the TLS certificates the webhook uses. It is a hard prerequisite — the operator will not start without it.
helm install \
  cert-manager oci://quay.io/jetstack/charts/cert-manager \
  --version v1.20.2 \
  --namespace cert-manager \
  --create-namespace \
  --set crds.enabled=true
Step 4 — Install the OpenTelemetry Operator
helm repo add open-telemetry https://open-telemetry.github.io/opentelemetry-helm-charts
helm repo update

helm install opentelemetry-operator open-telemetry/opentelemetry-operator \
  --namespace opentelemetry-operator-system --create-namespace \
  --set "manager.collectorImage.repository=ghcr.io/open-telemetry/opentelemetry-collector-releases/opentelemetry-collector-k8s"
You can verify the operator registered its CRDs:
Step 5 — Create an Instrumentation resource
The Instrumentation CR (Custom Resource) is the central configuration object that the webhook consults when injecting into a pod. It specifies:
exporter.endpoint— where to send telemetry (your OTel Collector or a Grafana Cloud OTLP endpoint)propagators— which context propagation formats to use across service boundariessampler— what fraction of traces to recordjava— Java-specific settings (agent image, extra env vars, resource requirements)
kubectl apply -f - <<EOF
apiVersion: opentelemetry.io/v1alpha1
kind: Instrumentation
metadata:
  name: demo-instrumentation
  namespace: default
spec:
  exporter:
    endpoint: http://grafana-k8s-monitoring-alloy-receiver.monitoring:4317
  propagators:
    - tracecontext
    - baggage
  sampler:
    type: parentbased_traceidratio
    argument: "1"
EOF
Verify it was created:
kubectl get instrumentation -n default
# or for more detail:
kubectl describe instrumentation demo-instrumentation -n default
Note
Java auto-instrumentation defaults to OTLP gRPC on port 4317. This is different from the http/protobuf protocol on port 4318 used by some other languages. If your collector only exposes http/protobuf, you can override the protocol per-language in the java.env section (see Java-specific configuration below).
Namespace and deployment order matter
The Instrumentation CR must exist in the cluster before your application pods are created. If you deploy the app first, the webhook will find no CR to reference and injection will be skipped. Also, the annotation in the deployment references this resource as default/demo-instrumentation — the namespace/name prefix is required when the instrumentation resource lives in a different namespace than the pod.
Step 6 — The Java application
The rolldice app (source code) is a minimal Spring Boot service that exposes /rolldice and returns a random dice roll.
src/main/java/com/example/rolldice/RolldiceController.java
@RestController
public class RolldiceController {

    private static final Logger logger = LoggerFactory.getLogger(RolldiceController.class);

    @GetMapping("/rolldice")
    public String index(@RequestParam("player") Optional<String> player) {
        int result = this.getRandomNumber(1, 6);
        if (player.isPresent()) {
            logger.info("Player {} is rolling the dice, result: {}", player.get(), result);
        } else {
            logger.info("Anonymous player is rolling the dice, result: {}", result);
        }
        return Integer.toString(result) + "\n";
    }
    ...
}
Notice what is absent from pom.xml: there are zero OpenTelemetry dependencies. The app itself is completely unaware of tracing or metrics — that is the point of zero-code instrumentation.
Step 7 — Build and push the Docker image
The Dockerfile is a standard two-stage Maven build. There is no OTel agent baked in — the operator injects it at runtime via an init container. You can also find the Dockerfile here:
FROM maven:3.9-eclipse-temurin-17 AS build
WORKDIR /app
COPY pom.xml .
RUN mvn dependency:go-offline -q
COPY src ./src
RUN mvn package -DskipTests -q

FROM eclipse-temurin:17-jre
WORKDIR /app
COPY --from=build /app/target/rolldice-0.0.1-SNAPSHOT.jar app.jar
EXPOSE 8080
ENTRYPOINT ["java", "-jar", "app.jar"]
Build and push (replace knappek with your Docker Hub username):
Step 8 — Deploy the application
The Kubernetes manifests are stored here.
deployment.yaml
apiVersion: apps/v1
kind: Deployment
metadata:
  name: rolldice
  labels:
    app: rolldice
spec:
  replicas: 1
  selector:
    matchLabels:
      app: rolldice
  template:
    metadata:
      annotations:
        instrumentation.opentelemetry.io/inject-java: "default/demo-instrumentation"
      labels:
        app: rolldice
    spec:
      containers:
        - name: rolldice
          image: knappek/rolldice:latest
          ports:
            - containerPort: 8080
          readinessProbe:
            httpGet:
              path: /rolldice
              port: 8080
            initialDelaySeconds: 10
            periodSeconds: 5
          resources:
            requests:
              cpu: "100m"
              memory: "256Mi"
            limits:
              cpu: "500m"
              memory: "512Mi"
Info
This deployment manifest actually has a bad readinessProbe as it executes a GET /rolldice request every 5 seconds and thus rolls the dice of the application. We can keep that for this demo to illustrate some traffic.
The annotation
The single annotation instrumentation.opentelemetry.io/inject-java: "default/demo-instrumentation" is the entire instrumentation configuration from the app's perspective. The value tells the webhook exactly which Instrumentation CR to use.
The annotation value can take four forms:
| Value | Behaviour |
|---|---|
"true" |
Inject using the single Instrumentation CR in the same namespace |
"my-instrumentation" |
Inject using the named CR in the same namespace |
"other-ns/my-instrumentation" |
Inject using a named CR from a different namespace |
"false" |
Explicitly disable injection (useful to opt out when a namespace-level annotation enables it) |
Annotation placement
The annotation must go in spec.template.metadata.annotations (the pod template), not in the top-level metadata.annotations on the Deployment itself. The webhook acts on Pod creation events, not Deployment events.
Namespace-level injection
You can also apply the annotation to a Namespace object to instrument all pods in that namespace automatically, without annotating each Deployment individually. See the Operators auto-instrumentation documentation for more details.
service.yaml
apiVersion: v1
kind: Service
metadata:
  name: rolldice
spec:
  selector:
    app: rolldice
  ports:
    - protocol: TCP
      port: 80
      targetPort: 8080
  type: ClusterIP
Apply both:
Step 9 — Verify the injection
Check the init container
The clearest sign that injection succeeded is the presence of an init container on the pod. Check events for the pod:
Or inspect the pod directly:
Look for an init container section like:
Init Containers:
  opentelemetry-auto-instrumentation-java:
    Image: ghcr.io/open-telemetry/opentelemetry-operator/autoinstrumentation-java:latest
    State: Terminated (Completed)
Check the injected environment variables
You should see:
JAVA_TOOL_OPTIONS:          -javaagent:/otel-auto-instrumentation-java/javaagent.jar
OTEL_SERVICE_NAME:          rolldice
OTEL_EXPORTER_OTLP_ENDPOINT: http://otel-collector:4318
OTEL_PROPAGATORS:           tracecontext,baggage
... // and other OTEL_ env variables
Check the app logs
The Java agent prints a startup banner when it loads cleanly:
You should see a line such as:
[otel.javaagent 2026-...] [main] INFO io.opentelemetry.javaagent.tooling.VersionLogger - opentelemetry-javaagent - version: x.x.x
If you see no agent output, check the operator logs for webhook errors:
kubectl logs -l app.kubernetes.io/name=opentelemetry-operator \
  --container manager \
  -n opentelemetry-operator-system \
  --tail=50
Step 10 — Generate traffic
Info
As mentioned earlier, the readinessProbe of the Deployment already generates traffic
Port-forward the service and send some requests:
In a separate terminal:
curl "http://localhost:8080/rolldice?player=Alice"
curl "http://localhost:8080/rolldice?player=Bob"
curl "http://localhost:8080/rolldice"
Traces, metrics, and logs are now flowing to the collector endpoint defined in the Instrumentation CR — no code changes required.
Step 11 - Verify telemetry in Grafana Cloud
Navigate to your Grafana Cloud stack on https://STACK_NAME.grafana.net/explore and select your default Prometheus datasource. Select Label filters service_name=rolldice or execute the promql query
You can do the same using the Tempo or Loki datasource.
What the operator injected (under the hood)
Inspect the full mutated pod spec to see everything the webhook added:
| Addition | What it does |
|---|---|
Init container opentelemetry-auto-instrumentation-java |
Copies the Java agent JAR into the shared volume at /otel-auto-instrumentation-java/ |
emptyDir volume opentelemetry-auto-instrumentation-java |
Shared between the init container and the app container; exists only for the lifetime of the pod |
JAVA_TOOL_OPTIONS env var |
Tells the JVM to attach the agent at startup; respected by any standard Java launcher |
OTEL_SERVICE_NAME |
Set to the pod's app label (or deployment name); becomes the service.name resource attribute on all telemetry |
OTEL_EXPORTER_OTLP_ENDPOINT |
Pulled from spec.exporter.endpoint in the Instrumentation CR |
OTEL_PROPAGATORS |
Comma-separated list from spec.propagators in the Instrumentation CR |
OTEL_TRACES_SAMPLER / OTEL_TRACES_SAMPLER_ARG |
Pulled from spec.sampler in the Instrumentation CR |
other OTEL_* env variables |
some default OTEL environment variables automatically injected if not explicitly set differently in the Instrumentation CR |
Java-specific configuration
The Instrumentation CR has a java section for Java-specific overrides. Common use cases:
Pin a specific agent version
Override the exporter protocol to http/protobuf
If your collector only has a http/protobuf (port 4318) endpoint:
spec:
  java:
    env:
      - name: OTEL_EXPORTER_OTLP_PROTOCOL
        value: http/protobuf
      - name: OTEL_EXPORTER_OTLP_ENDPOINT
        value: http://otel-collector:4318
Disable a specific auto-instrumented library
The Java agent instruments dozens of frameworks automatically. To turn off a single one:
To disable all default instrumentations and opt in selectively:
spec:
  java:
    env:
      - name: OTEL_INSTRUMENTATION_COMMON_DEFAULT_ENABLED
        value: "false"
      - name: OTEL_INSTRUMENTATION_SPRING_WEB_ENABLED
        value: "true"
More information here.
Troubleshooting checklist
| Symptom | Check |
|---|---|
| Pod starts but no init container present | Annotation is on the Deployment's metadata, not spec.template.metadata |
| Init container present but no traces | Instrumentation CR endpoint unreachable from the pod — verify the collector service is running and the FQDN is correct (http://service.namespace.svc.cluster.local:4318) |
| Operator logs show webhook errors | cert-manager certificates may not be ready yet; re-check with kubectl describe certificate -n opentelemetry-operator-system |
Instrumentation CR not found |
CR was deployed after the pod; delete and re-create the pod so the webhook can re-evaluate |
| Wrong service name in traces | Set OTEL_SERVICE_NAME explicitly in spec.java.env to override the default |
Cleanup
kubectl delete -f source/rolldice/k8s/
kubectl delete instrumentation demo-instrumentation -n default
helm uninstall opentelemetry-operator -n opentelemetry-operator-system
kubectl delete -f https://github.com/cert-manager/cert-manager/releases/latest/download/cert-manager.yaml
kind delete cluster --name otel-demo
Further ideas
- Try out Beyla Injector (without required eBPF). Currently, it only seems to work on Kubernetes and seems to work similarly to the OpenTelemetry Operator (see this Github PR).